Blog
Platform and Industry updates
-

06/15/2026
Why Wall Street Dominates Placement-Agent Rankings — and Why Boutiques Still Matter
Third-party marketers. Placement agents. Whatever term you use for them, 90% of firms don’t list a marketer on their EDGAR filings, clearly preferring to go it alone on the fundraising trail.
But for the 10% that do, plenty of marketing firms are doing something very right, because they help private fund investment managers raise billions of dollars of assets every year across the entire spectrum of asset classes and strategies.
As part of our process here at 9AT, our scouring of the Form ADV and Form D filings shows what would seem to be a huge 2,500 firms receiving a credential as a ‘marketer’ on regulatory filings, good for more than $21.68trn of gross asset value (GAV) in aggregate.
Leading the way are the investment banks. That should not be a surprise, as these firms are often helping to raise capital for the largest, most established alternative asset managers, and those mandates can be enormous. A single assignment for a multi-billion-dollar private equity, infrastructure or private credit fund can have a greater impact on rankings than numerous smaller mandates combined.
Add to that their longstanding relationships with their global network of investors, including pension funds, sovereign wealth funds and insurance companies, and the wider suite of advisory services they offer beyond capital raising, and it makes sense why these firms dominate the leaderboard, as can be seen from Table 1 below.
Table 1: Top 10 Third Party Marketers for Private Investment Funds, by Total Fund GAV*
Firm/Marketer
Total Gross Asset Value
MORGAN STANLEY $ 942,011,984,267 JPMORGAN CHASE $ 933,620,411,662 UBS GROUP $ 915,207,040,644 MIRAE ASSET $ 824,372,342,544 GOLDMAN SACHS $ 582,078,583,510 MITSUBISHI UFJ ALTERNATIVE INVESTMENT CO LTD. $ 446,509,825,782 BANK OF AMERICA $ 444,116,913,829 BARCLAYS $ 396,654,165,981 CITIGROUP $ 359,064,457,932 ICAPITAL $ 259,192,007,320 Source: 9AT
*at June 24th, 2026
This dominance of large investment banks at the top of the rankings raises an obvious question, however: if global banks possess the scale, relationships and resources to lead the market, why do specialist third-party marketers continue to play such a prominent role in private markets fundraising?
The answer lies in a) the diverse needs of fund managers themselves and b) smaller and emerging managers being…too small and emerging for the bulge-bracket firms.
While the largest alternative asset managers may want and need global distribution capabilities, the long tail requires a more targeted, hands-on approach, which creates opportunities for boutique placement agents to carve out valuable niches.
Indeed, the distribution of assets raised is quite skewed; as can be seen from the Pareto chart below (Figure 1), the aggregate GAV rises quickly before tailing off.
Figure 1: Cumulative Distribution of Aggregate Assets Raised by US Third-Party Marketers
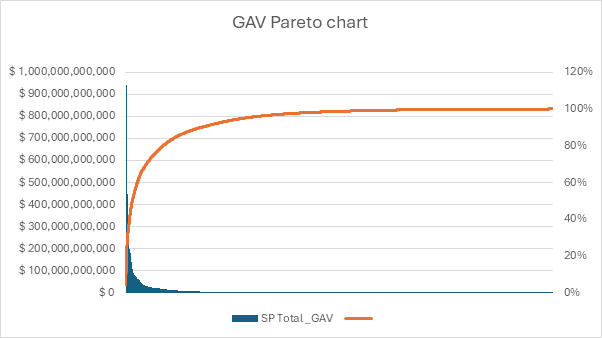
Source: 9AT
While it’s true that this pattern is reflective of competition dynamics, it is also due to functional specialisation within the fundraising ecosystem. Boutique placement agents tend to operate where the large, global platforms are either structurally less efficient or economically less incentivised to focus their efforts.
For emerging and mid-market managers in particular, fundraising is often less about broad global distribution and more about precision: identifying the right subset of institutional investors, crafting a tightly aligned narrative, and maintaining close, consistent (but not overbearing!) engagement throughout the process. In this context, smaller third-party marketers can offer a level of focus and responsiveness that is difficult to replicate at scale.
Boutique firms are also often more deeply embedded in specific strategies, geographies, or investor networks particularly private investors such as family offices, multi-family offices, HNWIs, etc., enabling them to access capital that can meet quicker, respond quicker, and write a check quicker.
As a result, while the Pareto distribution highlights a highly concentrated top end of the market, it also obscures the more nuanced reality that the long tail of third-party marketing support is structurally important, sustained by specialist intermediaries that play a critical role in connecting capital with emerging and niche investment strategies.
Within the cohort of advisors that use marketers, private equity leads the way, and by quite a way – 43.3% of all funds using a marketer are private equity funds. That’s almost double the second-placed category – hedge funds – with 3,4560 funds, or 22.3%.
Table 2: Preponderance of Advisor Category Using a Marketer
Category Funds Share Private Equity 6,696 43.3% Hedge Fund 3,450 22.3% Venture Capital 1,636 10.6% Other 1,599 10.3% Real Estate 1,081 7.0% Securitized Asset 984 6.4% Liquidity 35 0.2% Source: 9AT
Part of the reason would be that there are just more private equity funds that file to the EDGAR database. That in turn makes competition intense, and hiring dedicated expertise might be perceived as providing a capital raising edge. Plus, their larger size on average requires the target investor to be able to write a bigger check. That means less friends and family, more institutions, which is where placement agent relationships can shine.
Going back to the long tail shows us that for the 2,500 firms in our dataset, the 90th percentile is reached after only 423 firms, meaning that the remaining 2,077 support ‘just’ a couple of trillion dollars out of the $21.68trn total.
But those two trillion dollars are precisely where a) much of the innovation in private markets originates: first-time funds, specialist strategies, regional managers and emerging teams that collectively shape the next cycle of institutional allocation and b) niche capital raising relationships lie.
The majority of funds seem to be content with going down the DIY asset-raising route. But for those that aren’t – particularly new and emerging managers - there is clearly plenty of potential support out there.
Editor's Picks:
Here are a handful of articles that we’ve seen recently that we found interesting. Hopefully, you do, too!
- Hedge funds bet against European carmakers on Chinese competition fears
- Fewer LPs plan to increase allocations to private credit over next year
- Private equity bosses turn to carried interest loans as payouts stall
- Detroit Office CMBS: Limited Securitization, Divergent Credit Outcomes
- How to invest when everything is moving too fast
-

05/13/2026
What’s the Point of the Multiple Adviser Disclosure in Form ADV?
Form ADV, the disclosure document filed with the Securities and Exchanges Commission (SEC) by private fund advisers each year contains a treasure trove of information, and here at 9AT, one of our specialties is aggregating that data and formatting it so that it can be analysed and understood for our clients.
Most people focus on the obvious data points - assets under management, number of funds, fund category, etc. But there are plenty of others, including some that offer a window into the inner workings of an adviser, like the use of multiple investment advisers within a single private fund structure.
Section 7B of the ADV is where advisers provide information specific to each private fund to which they act as an adviser. Within this section, question 18 asks whether any investment advisers beyond those already disclosed elsewhere in the filing also advise the private fund in question. At first glance, this may appear to be nothing burger but in reality, it can provide meaningful insight into how a fund is managed, how responsibilities are allocated, and how the broader private funds market is evolving.
Many of the ‘other advisers’ listed on the form don’t provide significant insights - they’re simply subsidiaries of the parent adviser (think ‘Amazing Capital Management Europe’ being an ‘other adviser’ to ‘Amazing Capital Management 1 LP’, for example). In these cases, the arrangement is entirely routine and reflects the increasing complexity and specialization of modern private markets investing.
But some are more interesting. A multi-strategy hedge fund may allocate different portfolio sleeves to specialist external managers, for example. And a private equity platform may use separate advisory entities for deal origination, sector-specific expertise, or portfolio management functions. In each case, multiple advisers can help improve execution, deepen specialist knowledge, and broaden investment capabilities.
As a result, analyzing this field in the Form ADV has become increasingly valuable, particularly for investors and service providers.
For institutional investors and capital allocators, the presence of multiple advisers can offer insight not only into a manager’s investment model, but their operational model and governance framework as well. Investors conducting due diligence often want to understand precisely who exercises investment discretion, how decisions are made, and whether responsibilities are clearly delineated.
Obviously (you would hope obviously) that this comes up in due diligence meetings with the parent adviser. But while the use of multiple advisers may indicate a sophisticated and institutionalized platform, particularly in large or globally diversified advisers, on the flip side, it may introduce additional complexity around oversight, conflicts of interest, or fee structures, all important considerations for investors looking at placing capital.
For compliance professionals and regulators, the field helps identify how advisory functions are distributed across entities. The SEC has long focused on ensuring that advisers do not obscure control, avoid disclosure obligations, or create undisclosed conflicts through fragmented organizational structures and the information found in this field supports these goals.
The data is also increasingly useful for researchers and market analysts seeking to understand broader industry trends. Changes in the prevalence of multiple-adviser structures can reveal important shifts within the private funds market itself. One example of this is the hedge fund ‘pod shop’ concept. While most people know the brand names in the space, not all pod shops are the same; some don’t have any ‘other advisers’, so the fund is simply an aggregate of many internal portfolio managers, and some do. Data for Form ADVs filed in 2025 suggests that only 114 out of 1,798 hedge funds on the spreadsheet disclose “other managers” so it will be interesting to see if this increases over time.
The existence of multiple advisers should not automatically be interpreted as being either positive or negative. In many cases, it simply reflects the realities of modern private markets investing. The significance lies less in the structure itself and more in what the structure reveals about a fund’s operational approach, strategic ambitions, and governance framework.
But as the private funds industry continues to expand and diversify, operational transparency is growing in importance. The Form ADV is full of data that can offer a glimpse into the inner workings of a fund, and this is just one example.
Editor's Picks:
Here are a handful of articles that we’ve seen recently that we found interesting. Hopefully, you do, too!
-

04/08/2026
Slowing Pace of Auditor Change by US Private Funds but New Names Appear To Be Taking Share
Those of you who follow our blog will likely recall that in the past two Aprils, we have published an article that takes a look at how many private funds decided to raise something of a red flag in the previous year; namely, changing auditor.
We’re not in the business of disappointing our followers, so here we are with this year’s update!
Now that the end of the first quarter is in the books and all private funds will have filed their Form ADV for the prior year, we can crunch the numbers. And the ‘glass half full’ perspective is that there has been an improvement from last year.
In 2024 (specifically, Form ADVs filed in 2025), the category with the fewest auditor changes (as a percentage of the overall category) was venture capital, where only 1.9% of funds changed provider. But in the ‘other’ category, 4.7% of them did.
This year, the picture is a little different. Venture fell to 1.2% and Other to 2.7% and there were also falls in hedge funds and private equity (Figure 1 below).
Figure 1: Private Funds That Changed Auditor in 2024 and 2025, by Type
2024
2025
Fund Type # of Funds Changed - 2024 Total Funds - 2024 % Funds That Changed Auditor - 2024 # of Funds Changed - 2025 Total Funds – 2025 % Funds That Changed Auditor - 2025 Hedge Fund 611 17,550 3.5% 339 22,900 1.5% Other 491 10,477 4.7% 320 12,020 2.7% Private Equity 1,181 39,491 3.0% 1,325 47,635 2.8% Real Estate 269 7,367 3.7% 309 8,184 3.8% Venture Capital 642 33,085 1.9% 478 39,087 1.2% Source: 9AT
*Securitized Asset Funds and Liquidity Funds are excluded due to lack of statistical significance
The reasons why the numbers improved from last year are, admittedly, difficult to pin down with any certainty. But educated guesses would suggest that fund managers tend to stick to what they know in times of uncertainty and 2025 was indeed uncertain, both geopolitically and from a macroeconomic perspective.
Changing auditor does not necessarily have to be the red flag that it seems like on the surface – often the manager might change due to price, or a perceived better service offered by a different provider.
And there has been – is still – a human capital challenge in the audit industry more broadly which has had a secondary impact of making the larger firms more selective in terms of which clients they onboard.
Still, some change did happen, of course, and hidden among the data are some interesting titbits, as can be seen in Figure 2 below.
Figure 2: US Private Fund Auditor Changes, by Replacement Auditor, 2025
Rank Overall Hedge Fund Other Private Equity Real Estate Venture Capital 1 KPMG KPMG Grant Thornton Deloitte KPMG KPMG 2 Deloitte Eisner Amper KPMG PwC Ernst & Young RSM 3 PwC Ernst & Young PwC KPMG RSM BDO 4 Ernst & Young Aprio Deloitte BDO Citrin Cooperman Cohn Reznick 5 BDO Richey May Plante Moran Ernst & Young Deloitte Baker Tilly Source: 9AT
In 2024, across the five largest categories of funds available for selection on Form ADV, non-Big Four audit firms featured nine times out of 25. This past year, that number rose to 13, more than half.
The change is clearly most pronounced in venture capital, where only one of the Big Four featured in the top five of the competitor replacement lists. And that the Big Four hold the top spots in the overall rankings is influenced heavily by the private equity category, which is the only sub-category in which all four firms feature; three times as many PE funds changed auditor last year than venture capital funds, so the overall picture becomes a little distorted.
There is a long tail in the audit market. Some 56 firms replaced an incumbent in the hedge fund space last year; 41 did so in the Other category, 62 in private equity, 37 in real estate and 39 in venture.
That means plenty of choice for private fund managers who perhaps delayed making a change in 2025 due to the aforementioned market uncertainty.
We can’t end our annual auditor missive without looking at the new funds that were filed on this year’s Form ADV. It’s hard to knock out the big four when it comes to new funds – they take most of the top four spots in most of the categories.
But what’s interesting is to look at who takes up spots 5-10, as shown in Figure 3 below.
Figure 3: New Private Fund Auditor Hires in 2025, Places 5-10, ordered by fund count
Rank Overall Hedge Fund Other Private Equity Real Estate Venture Capital 5 BDO Cherry Bekaert Grant Thornton BDO Baker Tilly KPMG 6 Frank Rimerman Richey May EisnerAmper RSM MMB Baker Tilly 7 RSM EisnerAmper BDO Grant Thornton CohnReznick BDO 8 Baker Tilly BDO RSM Sanville RSM RSM 9 Grant Thornton RSM Baker Tilly CohnReznick BDO Weaver 10 EisnerAmper Grant Thornton CohnReznick EisnerAmper Cherry Bekaert Sensiba Source: 9AT
While there is one category where one of the big four has been displaced by the top four spots – Frank Rimerman taking first place in venture capital – there seems to be something of a consistency in the remainder of the top 10, with RSM and BDO featuring in all categories and Grant Thornton, EisnerAmper, and Baker Tilly each featuring in four categories.
Without going into detail, it’s worth noting that these rankings are done by fund count; ordering it by Total GAV serviced can (and does!) change the ranking and the overall picture. It’s also worth noting that these take into account funds from firms that filed ADVs in the first quarter of this year. While that represents ~80% of alternative fund advisers, the other ~20% that will file throughout the remainder of the year may change these rankings.
The geopolitical landscape is, let’s say, in the news at the moment. More so than ever, indeed. And while there tends to be a risk-off approach to investing during times of market dislocation, this mentality might be seeping into vendor selection as well.
Whether the percentage of funds that change auditor this year increases or whether they remain in ‘let’s not rock the boat’ mode remains to be seen but what is certain – as certain as can be, of course – is that here at 9AT, we’ll be watching, and we’ll do this again next April, at least!
Editor's Picks:
Here are a handful of articles that we’ve seen recently that we found interesting. Hopefully, you do, too!
- When Oil Becomes the ‘Main Character', These Hedge Fund Strategies Outperform
- Moody's cuts outlook on US BDCs to 'negative' on redemption pressure, rising leverage
- PE does not blink in the face of new market disruptions
- CMBS Delinquency Rate Jumps in March 2026, Led by Surge in Lodging Rate
- It’s not your imagination: AI seed startups are commanding higher valuations
-

03/09/2026
How Artificial Intelligence Is Reshaping Research in the Private Funds Market
Not a day goes by at the moment when the topic of artificial intelligence (AI) doesn’t come up in some industry, somewhere.
Much of the mass media coverage of the tool in recent weeks has swung towards the negative, whether that be because of its incorporation into military processes or because of its enormous potential to erase certain jobs.
We’re not here to make moral judgements, however. But we can speculate on how AI might influence the day-to-day of the private funds market, the space we call home, because we’re seeing it evolve in real-time.
And we think that those who adapt to change will be the ones best poised to win in this new paradigm.
AI and the Evolution of Data Collection, Verification, and Cleaning
One of the most significant challenges in private markets has always been data quality. Unlike public markets, where information is widely standardized and reported in real time, private funds data often originates from multiple sources, formats, and reporting conventions. As a result, collecting, verifying, and cleaning this information has historically required a significant amount of manual effort.
AI is beginning to automate many of these processes. Machine learning models can identify patterns across datasets, flag inconsistencies, and reconcile discrepancies far more quickly than a person can. And it doesn’t get tired, of course, so can do more work, quicker. Natural language processing can also extract relevant information from unstructured sources such as regulatory filings, investor reports, or news announcements.
The benefits to users are considerable. First, better automation improves data accuracy and consistency, which ultimately leads to more reliable analysis. Second, it significantly accelerates the speed at which new information becomes usable. Instead of waiting for sometimes lengthy manual validation processes, investment professionals can access cleaner, more up-to-date datasets.
AI as a Catalyst for Faster and More Sophisticated Development
AI is also transforming how data platforms themselves are built. Increasingly, AI tools are being used by development teams to write code, generate documentation, test functionality, and identify potential issues within software environments.
Yes, there are potential hazards – just ask Amazon. But these AI-assisted development workflows allow engineering teams to build, update, and expand platforms more rapidly. Tasks that once required significant manual coding effort can now be accelerated with the help of AI agents that assist with both development and testing.
For users, the benefits are both direct and indirect. Faster development cycles mean that platforms can evolve more quickly in response to user needs. New datasets can be integrated faster, features can be refined more frequently, and improvements can be deployed with greater consistency, which all leads to providing the user with a better product, faster.
AI as a New Way to Interact with Data and Software Platforms
The two aforementioned changes, while improving database and software products and services, are largely back-end ones.
But perhaps the most visible change AI is bringing and will continue to bring to the private funds industry is how users interact with data systems themselves. Traditionally, accessing information from a data platform required navigating menus, filtering columns, or downloading datasets for further analysis, whether that be in Microsoft Excel itself or by uploading the data into an entirely different system.
AI-powered interfaces are creating a far more intuitive experience. Instead of manually constructing searches, users can increasingly ask questions in natural language, much like interacting with a generative AI tool now.
We are already seeing the movement towards this new way of working in internet search. Last summer, an Adobe survey suggested that 77% of Americans use ChatGPT as a search engine.
This trend will continue. An allocator needing to research private credit might ask a platform to identify funds with specific return characteristics, geographic exposures, or vintage-year performance. A manager might request a list of allocators in a particular area when they are travelling in that area. Service providers will do the same. The system interprets the question, searches the relevant datasets, and delivers the answer in seconds.
This conversational interface significantly lowers the barrier to data analysis. Professionals who may not have deep technical expertise can still extract sophisticated insights from complex datasets. It also allows users to explore information more dynamically, refining questions and discovering insights in real time.
Conclusion
Artificial intelligence is rapidly becoming a foundational technology in how the private funds industry works with data and software. Its impact extends far beyond simple automation. From improving the quality of underlying datasets, to accelerating platform development, to transforming the way users engage with information, AI is reshaping the entire data ecosystem.
But these advances do not replace the expertise or judgment that investment professionals bring to the market. Instead, they enhance it by reducing the friction involved in collecting, analyzing, and exploring data.As adoption continues to grow, the firms that benefit most will be two-fold: Suppliers that view AI not simply as a tool to improve the back-end, but to provide their customers with a better way to access what they want; and customers that adopt products and services that are pushing the envelope in terms of moulding their offering to their customer base.
Editor's Picks:
Here are a handful of articles that we’ve seen recently that we found interesting. Hopefully, you do, too!
- Equity market is a paradise for stockpickers and hedge funds
- Rise of structured private credit transactions adds challenges for risk analysis
- Allocators Prefer the ‘Fluffy Airy’ Words of Private Equity to the Hard Math of Hedge Funds
- CRE CLO Issuance Surges to Start 2026, Putting 2021 Peak Levels Within Reach
- Investors spill what they aren’t looking for anymore in AI SaaS companies
-

02/10/2026
The Democratisation of Alternative Investments: Opening the Floodgates, or Inviting the Spotlight?
Like many of you reading this, we were in Miami at the end of January for the Uncorrelated Miami conference. Lots of good panels, good speakers, and a good time was had by all – at least, the folks we spoke with.
And politics was never far from the conversation – regardless of which side of the aisle you sit, you can probably agree that there is a lot to talk about at the moment!
But there was something that sits at the intersection of politics and alternative investments that came up a few times during the networking breaks at the event, which was the ‘democratization of private markets’ and President Trump’s Executive Order requiring the Secretary of Labor to “reexamine the Department of Labor’s past and present guidance regarding a fiduciary’s duties under the Employee Retirement Income Security Act of 1974, as amended (ERISA) (29 U.S.C. 1104), in connection with making available to participants an asset allocation fund that includes investments in alternative assets. When conducting this re-examination, the Secretary shall consider whether to rescind the Department of Labor’s December 21, 2021, Supplemental Private Equity Statement.”
In plain English, the Department of Labor has been asked to clarify whether, and under what conditions, alternatives can sit inside 401(k) plans without breaching fiduciary duty.
For years, the phrase “democratization of alternative investments” has been doing the rounds like a buzzword in search of a definition and indeed, access itself isn’t new. Alternative assets have long been available through self-directed IRAs, but only for those willing to navigate complexity and accept full responsibility.
What’s different now is the question of scale and liability. Moving alternatives into 401(k)s doesn’t just widen access; it shifts accountability from individuals to plan sponsors and fiduciaries.
President Trump’s proposal to open up alternative investments to 401(k) pensions has dragged the conversation out of conference panels and into the mainstream. If even a fraction of retirement capital is allowed to flow into private equity, private credit, real assets, or hedge funds, the implications could be profound. The obvious question is not whether capital exists, but whether managers actually want it - or whether many quietly decide it’s a bridge too far.
On paper, the opportunity is enormous. The US 401(k) market runs into the tens of trillions of dollars. Even a modest allocation to alternatives would dwarf many existing institutional pools. For managers that have spent the past decade watching public markets dominate retirement portfolios, this feels like a long-awaited opening.
But who really wants to take the plunge?
Retail-adjacent capital, even when filtered through defined-contribution plans, comes with a very different level of scrutiny. Fee structures that pass with little or no comment in institutional due diligence suddenly look eye-watering. Liquidity terms that make perfect sense in a closed-end fund might raise uncomfortable questions when viewed through a retirement lens.
This is where the ‘democratization’ narrative starts to fray a bit.
For some firms, the trade-off is simple: more capital, more oversight; expanded disclosures, enhanced reporting, greater regulatory engagement, a clearer articulation of risk.
For larger firms, that’s manageable. These are the managers most likely to lean in early, shaping product design and setting the tone for how alternatives sit within retirement portfolios (assuming this goes ahead at all, of course).
For others, particularly those running more specific or even esoteric strategies, the picture looks different. The flexibility that defines many alternative approaches can quickly become a liability under heightened scrutiny. Being slightly opaque, slightly bespoke, or slightly hard to explain would likely be disqualifying, not charming, or even ‘cool’. Staying on the sidelines may feel safer than inviting regulators, plan sponsors, and yes, the media, into the room.
There’s also a philosophical issue that comes into play. Alternatives are popular with professional, accredited investors partly because they aren’t mass-market products. They tend to reward specialist knowledge – and patience (lots of it). In trying to make them more accessible, there is an argument to say that they could become diluted, whether that’s structurally, strategically, or both.
The Department of Labor (DoL) has already rescinded the 2021 supplemental statement on alternative assets in 401(k) plans – indeed, it did it quickly, only five days after the original Executive Order.
And it issued an advisory opinion related to when lifetime income investment options can be considered qualified default investment alternatives under federal law.
So, the DoL has been making changes. But will Trump’s proposal unleash a fundraising glut?
In last month’s blog article, we showed that there were 17,835 Form D filings in 2025, and you would expect this to increase should this initiative get the go ahead.
But perhaps less so in the short term. Lori Chavez-DeRemer is the current Secretary of Labor. Her deadline to report back is rapidly approaching (she was given 180 days from the date of the original executive order in August last year).
But even if she reports that incorporating alternatives into 401k pensions is feasible – given the many guardrails in place - that conclusion alone won’t trigger a wholesale shift in behavior. Access does not guarantee adoption. For many managers, the real question will be whether the promise of new capital outweighs the operational burden, regulatory scrutiny, and heightened transparency that inevitably follow. In other words, democratisation may open the door, but it won’t force anyone to walk through it, and certainly, not everyone will.
Editor's Picks:
Here are a handful of articles that we’ve seen recently that we found interesting. Hopefully, you do, too!
- With a Thin IPO Calendar, Hedge Funds Are Zeroing In on Biopharma
- As investors sour on software, private credit loans come into sharp relief
- Private equity exits rise as returns fall
- CMBS Delinquency Rate Increased to Open 2026 as Office Reached a New Record High
- Is Now The Best Or Worst Time In Venture Capital?
-

01/13/2026
Growth in New Alternative Investment Fund Filings Accelerates in 2025
It’s time for our annual look at the previous year’s SEC new Form D filings and the headline is that those on the capital raising trail for new hedge funds, private equity funds, venture capital funds and ‘other’ investment funds had a good year, with both the number of filings and the total aggregate sale value increasing significantly compared to 2024.
Table 1: Number of Filings by Form D Category, 2025 vs 2024
Category 2024 2025 % Change Hedge Funds 1,190 1,540 29.4% Other Investment Funds 2,585 3,021 16.9% Private Equity Funds 4,104 4,846 18.1% Venture Capital Funds 6,051 7,080 17.0% Other* 1,318 1,348 0.02% Total 15,248 17,835 17.0% Table 2: Aggregate Total Amount Sold by Form D Category, 2025 vs 2024, $bns
Category 2024 2025 % Change Hedge Funds 47.94 108.73 126.7% Other Investment Funds 76.93 129.07 67.8% Private Equity Funds 97.39 169.32 73.8% Venture Capital Funds 33.96 42.47 25.1% Other* 9.80 14.56 49% Total 266.01 464.15 74.4% *Other represents Form D funds that weren't marked as pooled investment funds in Section 4 of the Form D document
Clearly, 2025 was a good news story for the hedge fund industry, a welcome return to form. Indeed, the space has just posted its best annual return since 2009, with the HFR Fund Weighted Composite Index delivering a +12.64% return last year. But the two previous years were also solid, so allocators have clearly got more confident about the prospects for sustained double digit returns as they deployed capital in 2025 at levels more than twice those seen in 2024.
Every category was up, though. Private equity funds raised the most money in total, which is to be expected, but they’re going to need it, as dealmaking in the space in 2025 was the second best year on record and plenty more is expected to happen this year.
Indeed, the space had 16 of the top 20 new Form D filings last year, and while that number has dropped to ten in 2025, private equity remains the more frequent category seen in the top ten as can be seen in Table 3 below.Table 3: Top Twenty New Form D Filings, Jan 1 – Dec 31, 2025, by Total Amount Sold
Fund Name Total Amount Sold Category Graham Global Investment Fund II spc Ltd 14,962,472,776 Hedge Fund Graham Global Investment Fund I spc Ltd 10,779,431,606 Hedge Fund Atlas Capital Resources V LP 6,325,000,000 Private Equity Fund Founders Fund Growth II, LP 4,595,493,889 Venture Capital Fund Founders Fund Growth III, LP 4,595,493,889 Venture Capital Fund Blackstone Growth II - B L.P. 4,452,439,266 Private Equity Fund Blackstone growth II - BL L.P. 4,452,439,266 Private Equity Fund Principal Enhanced Property fund, L.P. 4,261,528,307 Other Investment Fund Millennium Global Estate Series Interests of the SALI Multi-Series Fund, L.P. 3,902,612,409 Hedge Fund Vintage X (Flagship) LP 3,883,940,000 Other Investment Fund Blackstone Life Sciences VI - BL L.P. 3,615,298,293 Private Equity Fund Blackstone Life Sciences VI - B l.P. 3,615,298,293 Private Equity Fund Ares Industrial Real Estate Fund LP 3,572,252,658 Private Equity Fund Verde Alpha Fund, Ltd. 3,440,709,254 Hedge Fund OA GP Fund, L.P. 3,425,365,442 Private Equity Fund Blackstone Capital Opportunities Feeder Fund V-R (CYM) LP 3,311,346,298 Private Equity Fund Ares Credit Secondaries (Unlevered) LP 3,200,407,950 Private Equity Fund Vintage X (Flagship) Offshore scsp 3,131,637,312 Other Investment Fund Intech U.S. Large Cap Growth Fund LLC 3,104,669,623 Other Investment Fund JMI Equity fund XII-B, L.P. 2,900,000,000 Private Equity Fund Something we mentioned last year is the number of funds with a $0 in the sales box when they file their Form D. 5884 of these funds – a little less than a third of the total – filed their new Form D with zero sales. So again, there should be some growth in the aggregate sales amount of 2025’s cohort of new funds in the coming 12-24 months.
So, to conclude, an excellent year for new private funds in the US. Sure, there is the same old story about larger firms gobbling up more of the assets, but there is clearly plenty of appetite for products across all categories from investors.
What will 2026 bring? We can’t be sure, of course, but the three interest rate cuts by the U.S. Federal Reserve between September and December last year will likely help those pounding the pavement asking investors for a check.
But for bulls like us, it’s good to see all categories delivering solid growth. A rising tide lifts all boats, after all, and provides more choice for investors.
Happy New Year!
Editor's Picks:
Here are a handful of articles that we’ve seen recently that we found interesting. Hopefully, you do, too!